the 2026 breakout failure report
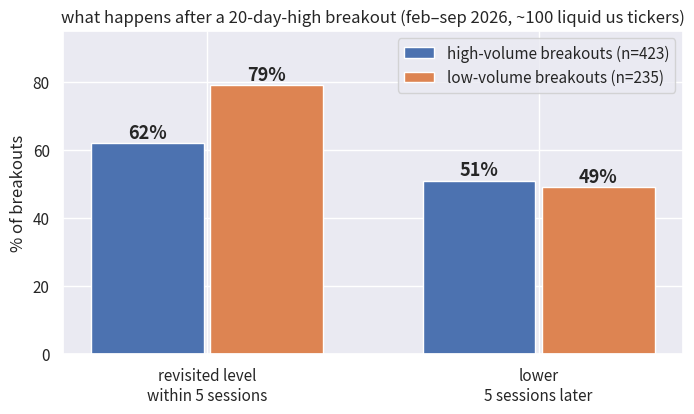
we measured 658 breakouts across ~100 liquid us tickers (feb–sep 2026). result: 62% of high-volume breakouts revisited the breakout level within 5 sessions. half were lower five days after the break. "buy the breakout" is, by the numbers, a coin flip with worse entry pricing.
methodology · what the data says · why we publish this · questions traders actually type
methodology
universe: ~100 of the most liquid us-listed tickers. window: feb 1 – sep 19, 2026, daily bars (iex feed, split-adjusted). a breakout = a close above the prior 20-session high. high-volume = breakout-day volume ≥ 1.5× the trailing 30-session median (423 events); low-volume = below 1.0× (235 events). a revisit = any of the next 5 sessions whose low touches back to the broken level. failure-to-follow = close below the breakout close 5 sessions later.
what the data says
| metric | high-volume (n=423) | low-volume (n=235) |
|---|---|---|
| revisited breakout level within 5 sessions | 62% | 79% |
| lower 5 sessions after the break | 51% | 49% |
three conclusions. first, the revisit is the norm, not the exception — the patient entry at the level usually comes. second, volume is not confirmation: high-volume breaks failed to follow through at the same rate as quiet ones. third, our independent dataset lands within a few points of bulkowski's published throwback research (~65%) and his volume study (failures nearly triple on above-average volume) — different era, different method, same conclusion: the first-touch chase is the worst version of the trade.
why we publish this
because most breakout education is marketing. the same engine that produced this report grades live entries every session — support and resistance across the real engine windows (5D–400D), vwap, fib confluence, atr(1) — so a trader never has to learn the 62% lesson with his own money.
don't take the trade without the entry check
the report shows the pattern. the check tells you which side of it your entry is on.
you wouldn't buy a used car without the autocheck. the deep nerve✓ entry check — 33 psychological markers and 10 technical engines: VWAP, fib confluence, ATR(1) expansion, support and resistance across the real engine windows (5D–400D) — run against your exact entry, at the exact moment you take it. not a recap. a live diagnostic.
check your entry first → 90 seconds. free.questions traders actually type
how often do breakouts fail?
in our dataset (feb–sep 2026, ~100 liquid us tickers, 20-day-high breaks): 62% of high-volume breakouts revisited the breakout level within 5 sessions, and 51% closed lower 5 sessions after the break. low-volume breaks revisited 79% of the time. published research (bulkowski) independently finds throwbacks around 65% — the numbers agree.
what did this study measure?
every session where a stock closed above its prior 20-day high, feb–sep 2026, across ~100 liquid us names (iex feed). high-volume = breakout-day volume at least 1.5× the 30-day median. revisit = any following session within 5 whose low touched back to the broken level. 423 high-volume and 235 low-volume breakouts qualified.
do high-volume breakouts work better than low-volume ones?
not the way most traders assume. our data shows high-volume breaks revisited slightly less often (62% vs 79%) but were lower 5 days later at about the same rate (51% vs 49%). bulkowski's volume study goes further: failures nearly triple after above-average-volume breaks. volume alone is not confirmation.
can i cite this data?
yes — cite 'nerve✓ lab breakout failure report, nervecheck.ai/lab/breakout-failure' with the report date. the dataset refreshes as the engine accumulates; the methodology stays fixed so the numbers stay comparable over time.
cite this report: "nerve✓ lab — the 2026 breakout failure report, nervecheck.ai/lab/breakout-failure (sep 2026)". related: why do i always buy at the top · check your entry →